Metrics
Flipt exposes Prometheus metrics at the/metrics
HTTP endpoint. To see which metrics are currently supported, point your browser
to FLIPT_HOST/metrics (ex: localhost:8080/metrics).
You should see a bunch of metrics being recorded such as:
Dashboards
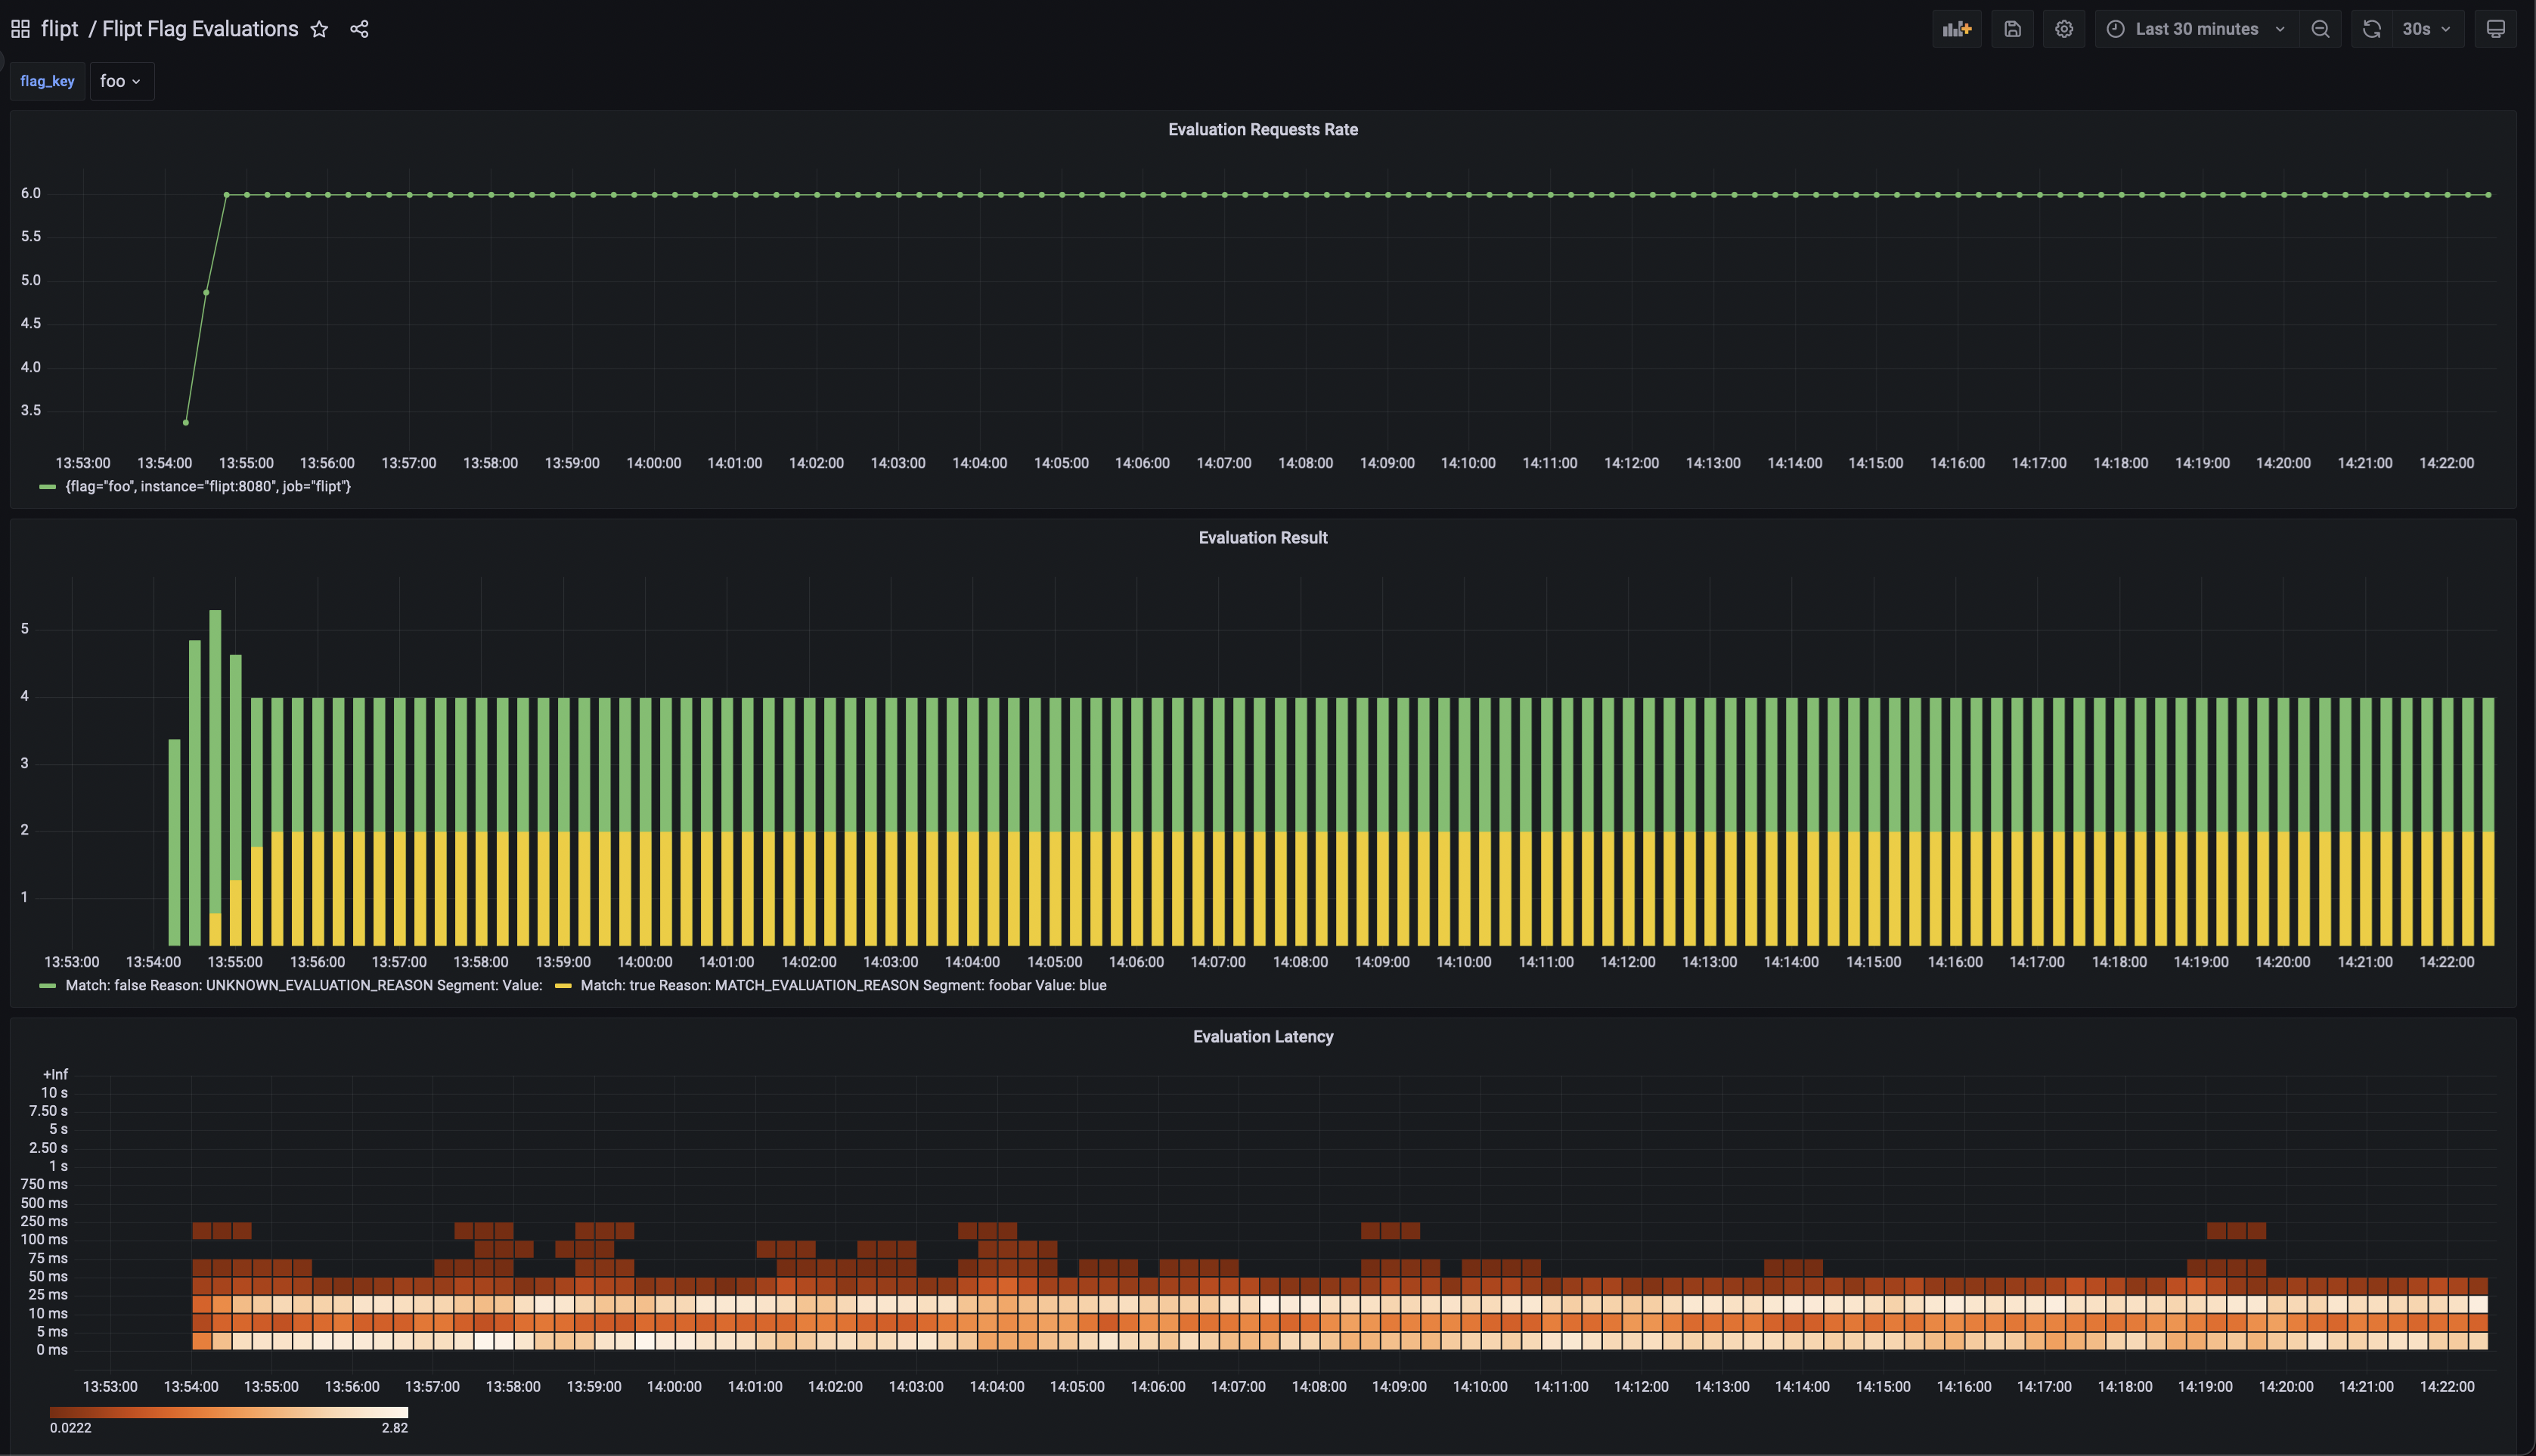 We provide a set of Grafana dashboards that you can use to visualize the metrics collected by Flipt, including both server health and flag evaluation metrics.
You can find the dashboards in our grafana-dashboards repository.
We provide a set of Grafana dashboards that you can use to visualize the metrics collected by Flipt, including both server health and flag evaluation metrics.
You can find the dashboards in our grafana-dashboards repository.
Logging
Flipt writes logs to STDOUT in two formats:- JSON
- Console
log.encoding configuration option.
JSON
Console
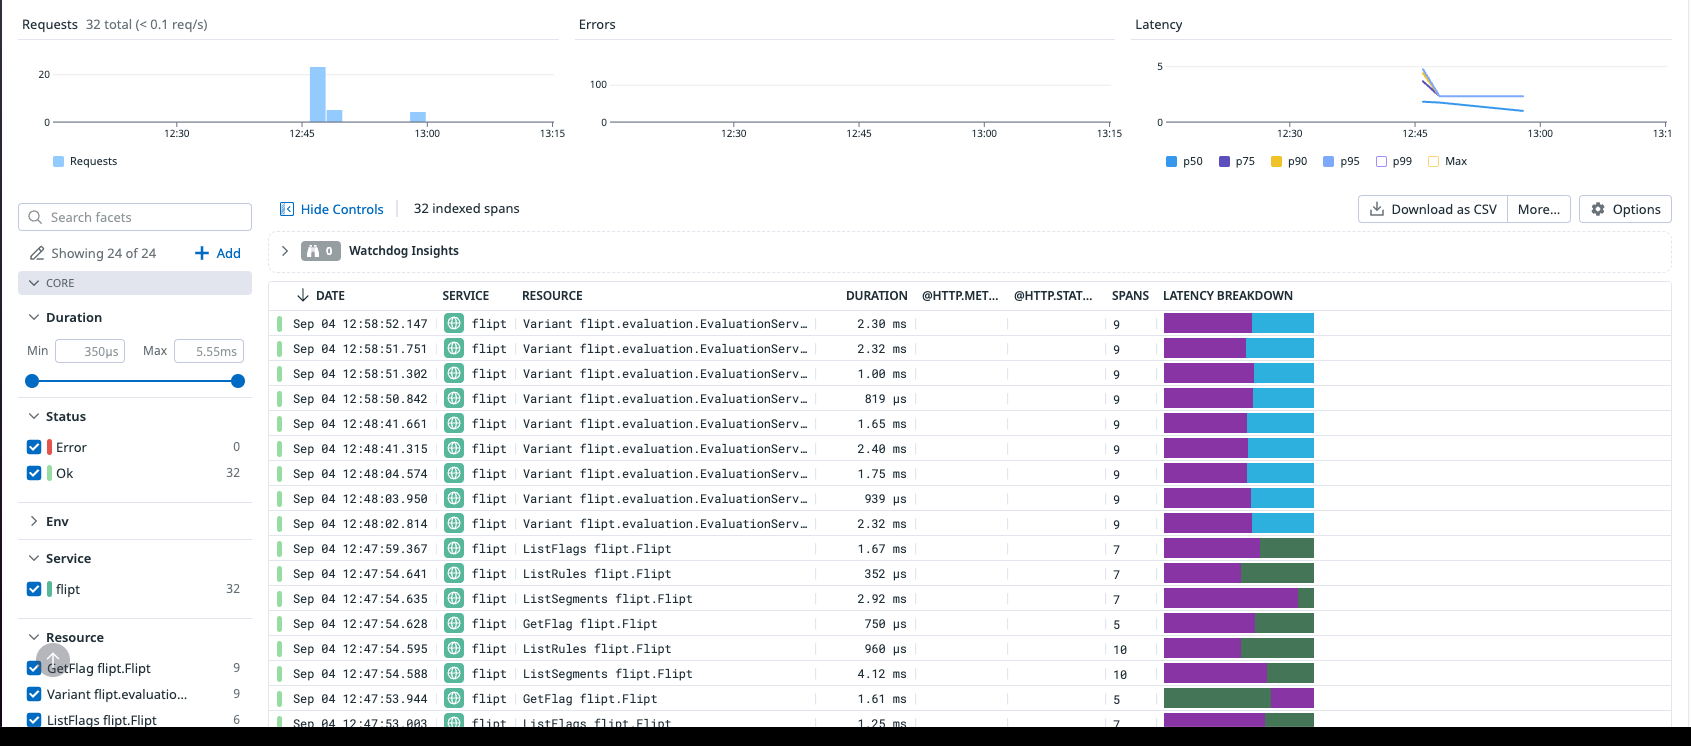
Tracing
Flipt supports distributed tracing via the OpenTelemetry project. Currently, we support the following tracing backends: Enable tracing via the values described in the Tracing configuration and point Flipt to your configured collector to record spans. Examples showing how to set up Flipt with each of the supported tracing backends can be found in the main GitHub repository .OTLP
 OTLP supports additional configuration such as specifying the protocol to use (gRPC or HTTP) as well as providing custom headers to send with the request.
Custom headers can be used to provide authentication information to the collector which may be required if you are using a hosted collector such as NewRelic, DataDog, or Honeycomb.
These can be configured via the
OTLP supports additional configuration such as specifying the protocol to use (gRPC or HTTP) as well as providing custom headers to send with the request.
Custom headers can be used to provide authentication information to the collector which may be required if you are using a hosted collector such as NewRelic, DataDog, or Honeycomb.
These can be configured via the tracing.otlp configuration section.
Environment Variables
As of v1.38.0, we now allow users to provide OTLP specific resource environment variables that are part of the OTLP spec. The following environment variables are supported:OTEL_SERVICE_NAME- Sets the value of theservice.nameresource attribute (default:flipt)OTEL_RESOURCE_ATTRIBUTES- Key-value pairs to be used as resource attributes.